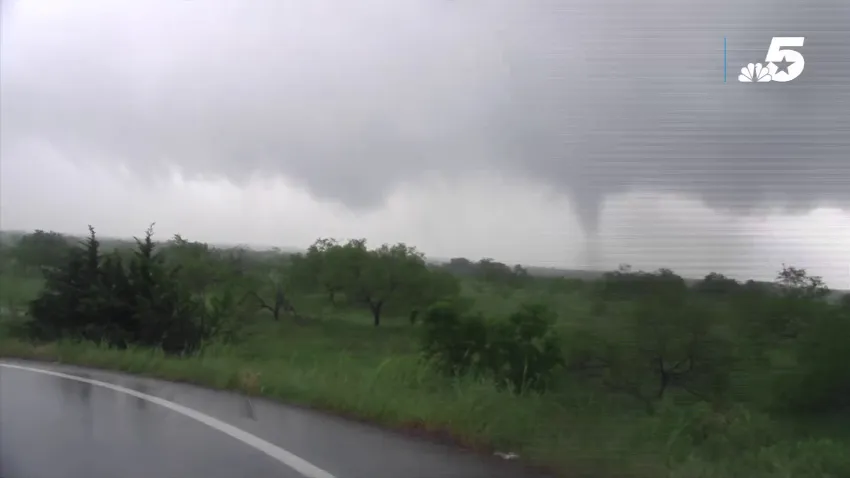
Timelapse shows tornado funnels trying to form in Ellis County
NBC 5 crews monitored the track of storms as they moved through North Texas. Timelapse video shows funnels attempting to form Friday afternoon near Rice in Ellis County.


-

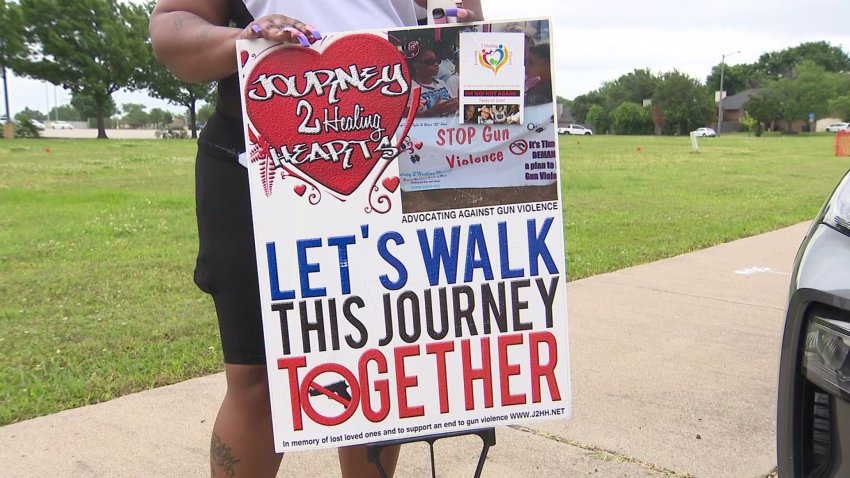
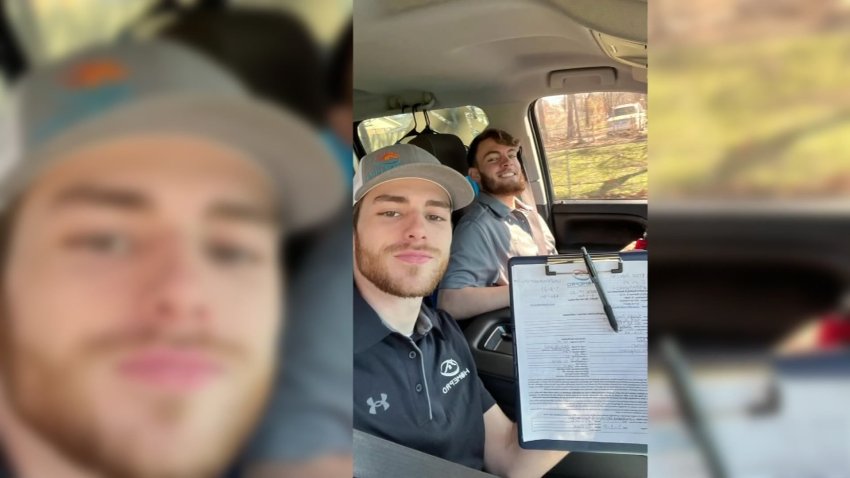
Pop-up market in Fort Worth to feature women-owned businesses
The event organizer grew up with brothers and felt the need to connect, collaborate, and create with other women.
-
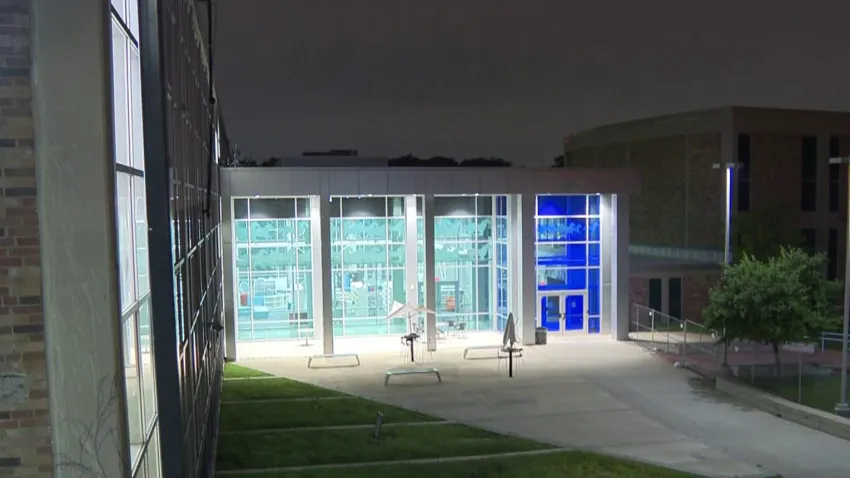
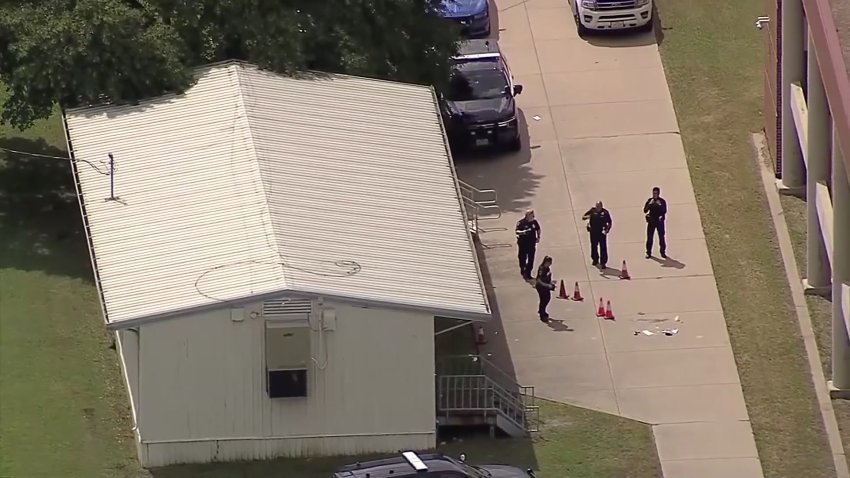
Roosevelt HS in Dallas ISD closed Friday after two students shot off-campus
Roosevelt High School in Dallas will be closed on Friday after a shooting incident took place on Thursday evening.
-
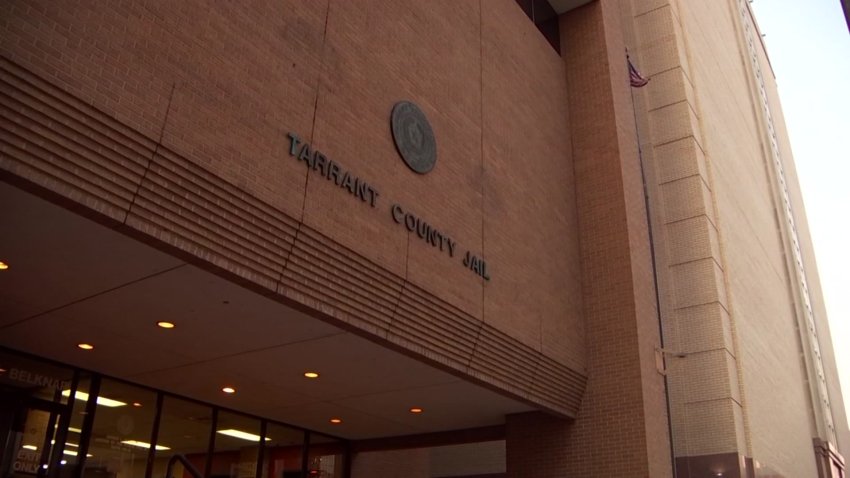
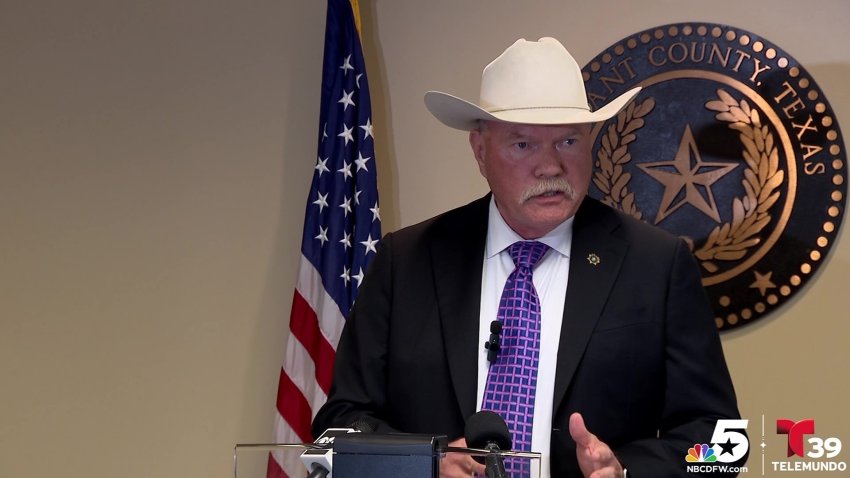
Tarrant Co sheriff responds to ongoing concerns over most recent jail death, 60+ inmate deaths since 2017
63 jail inmates have died since 2017, with the most recent death coming this past Sunday. NBC 5 obtained new numbers that show how deaths at the Tarrant County jail compare to the rest of the state.... -

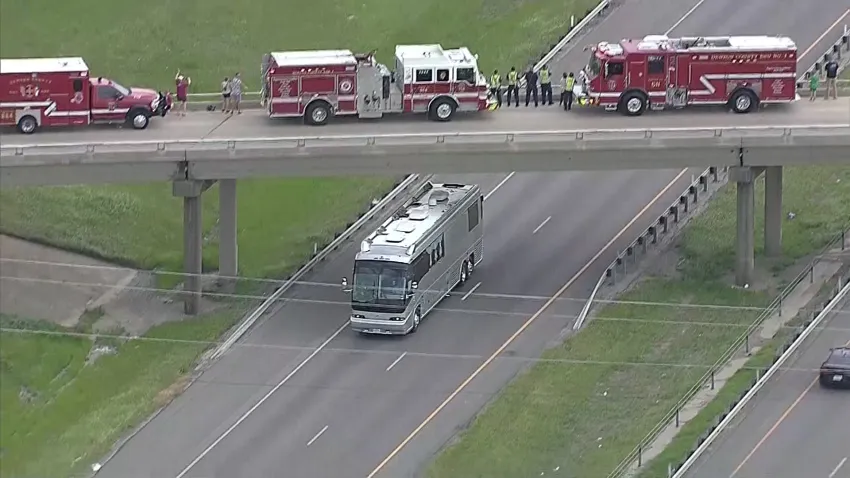
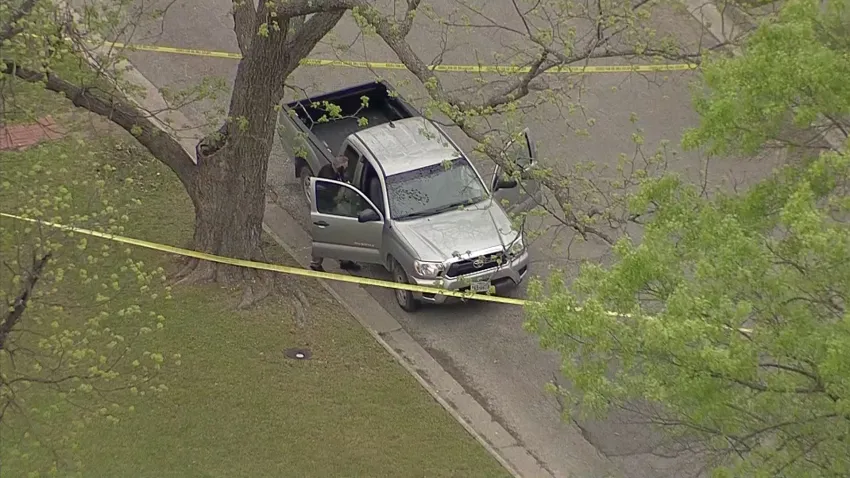
Suspect with knife killed in Arlington officer-involved shooting
Arlington police are investigating a shooting that involved an officer Thursday evening.