

- "The charts, as interpreted by Carolyn Boroden, suggest the tech-laden Nasdaq 100 really was due for a bounce this week and that bounce could continue," CNBC's Jim Cramer said Tuesday.
- However, Cramer said to be careful because Boroden believes "the overall technical picture remains ugly."
The Nasdaq 100 still faces an uncertain near-term outlook despite its intraday turnaround Monday and additional gains Tuesday, CNBC's Jim Cramer said, leaning on technical analysis from Carolyn Boroden.
"The charts, as interpreted by Carolyn Boroden, suggest the tech-laden Nasdaq 100 really was due for a bounce this week and that bounce could continue," the "Mad Money" host said. However, Cramer said to be careful because Boroden believes "the overall technical picture remains ugly."
Get DFW local news, weather forecasts and entertainment stories to your inbox. Sign up for NBC DFW newsletters.
Cramer said Boroden identified a potential bounce this week for the Nasdaq 100 through Fibonacci ratios, which she and other market technicians use to identify timing cycles that shed light on when a security may change direction. The root of the Fibonacci strategy is a numerical sequence identified in the 13th century by Leonardo Fibonacci, an Italian mathematician.
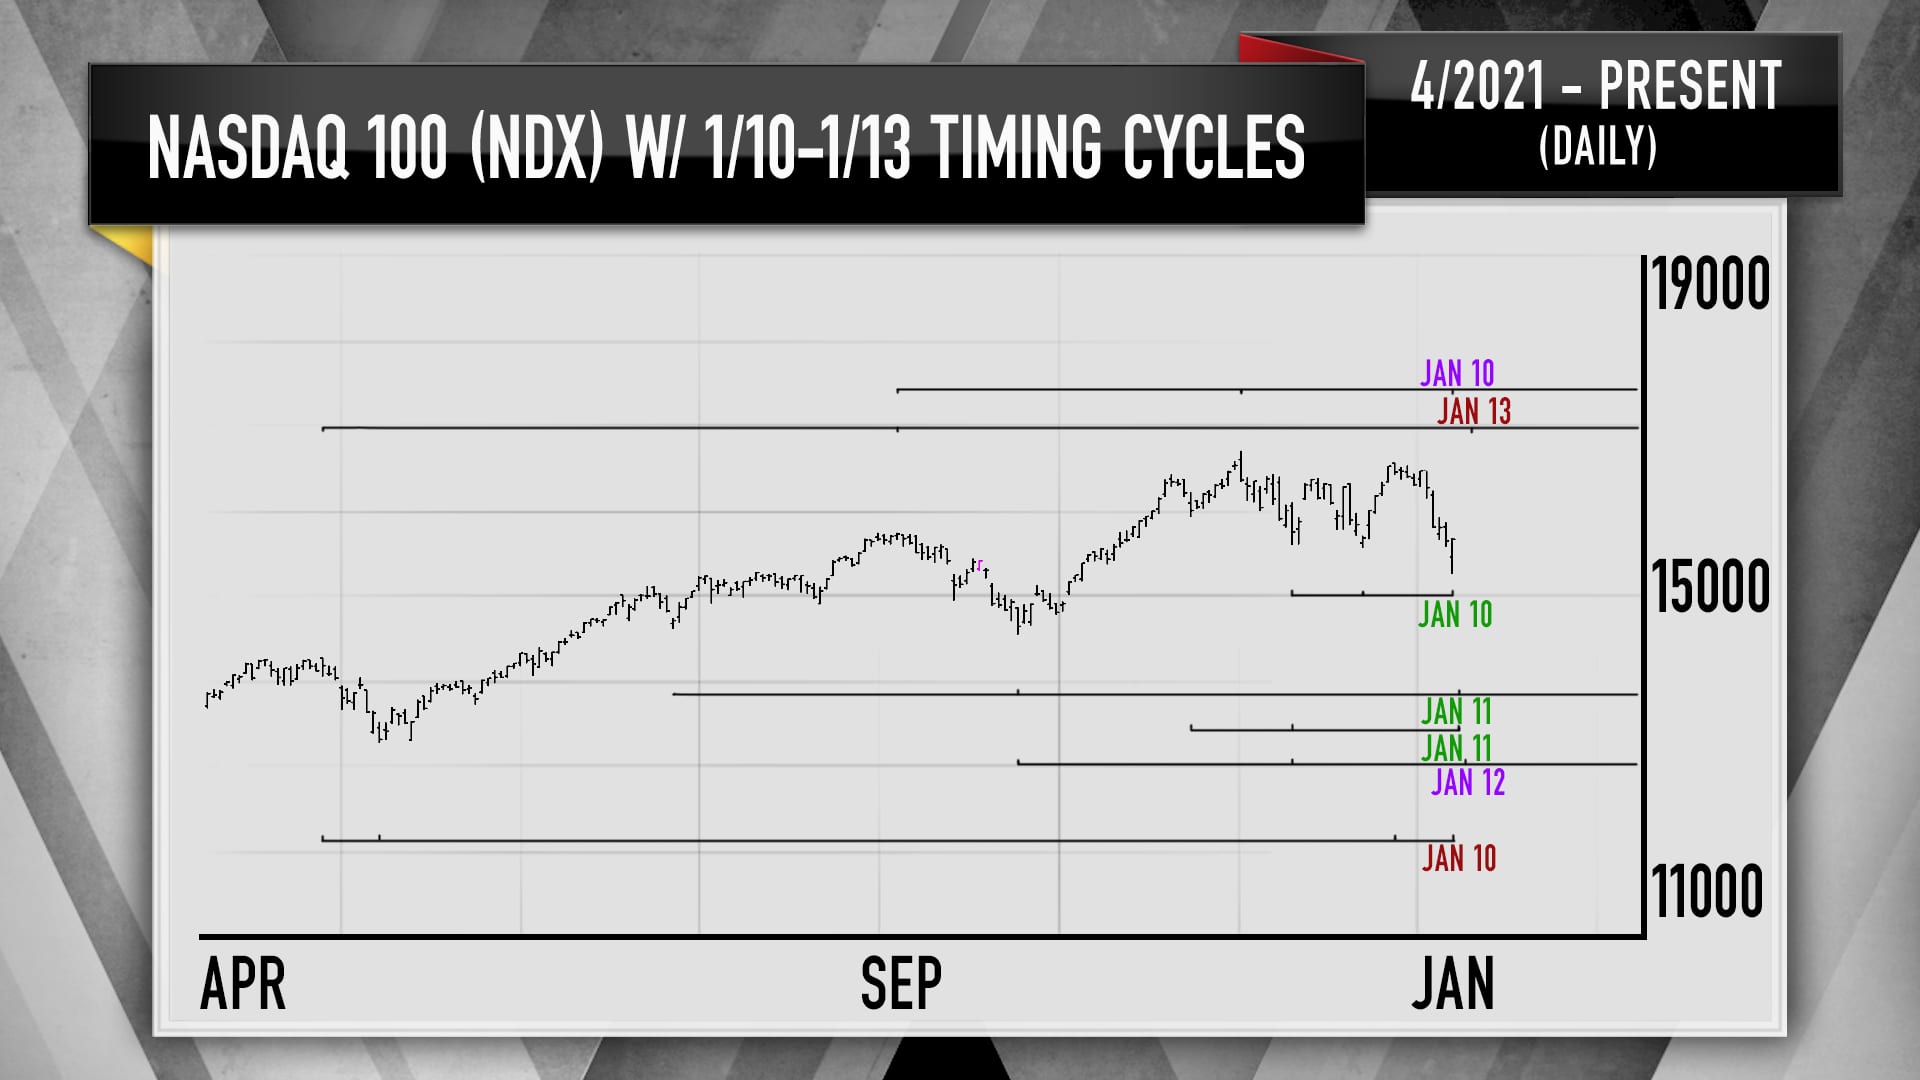
While Cramer said Boroden believes the tech rebound "could have legs," it's not entirely clear how long they will last. After all, he noted, tech's late December strength lasted for about a week and a half before giving way to the early 2022 weakness.
Money Report


Additionally, Boroden sees at least two bearish technical indicators that suggest it may be difficult for the index to enter a sustained upside move to new highs, Cramer said.
The first is that the Nasdaq 100 remains below its 50-day moving average, Cramer said, calling that a "kiss of death for most chartists." He added, "There are a lot of money managers out there who follow these charts, even if they won't always admit it."
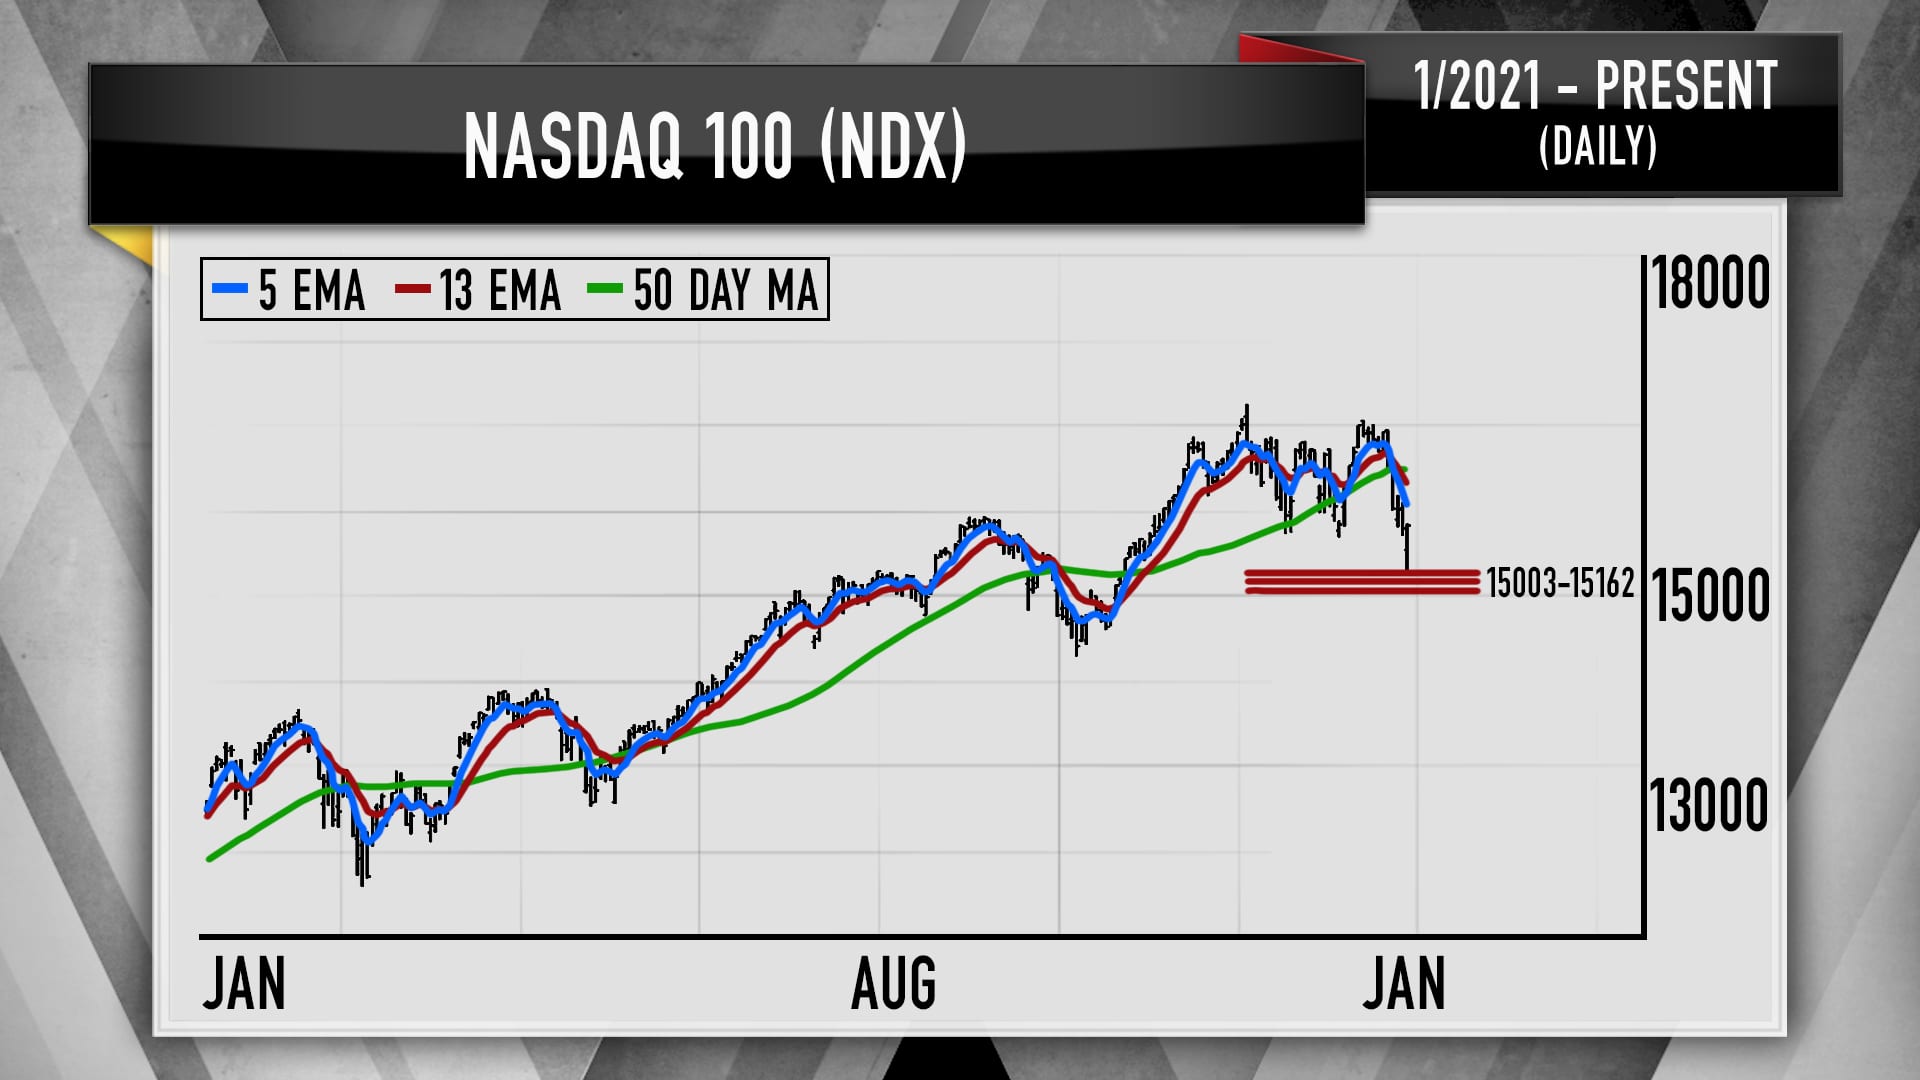
The second is the Nasdaq 100's five-day exponential moving average and its 13-day exponential moving average, Cramer said. "When the five-day crosses below the 13-day, that's one of [Boroden's] most reliable sell signals, and right now it's very much in effect for the Nasdaq 100."
Sign up now for the CNBC Investing Club to follow Jim Cramer's every move in the market.
Disclaimer
Questions for Cramer?
Call Cramer: 1-800-743-CNBC
Want to take a deep dive into Cramer's world? Hit him up!
Mad Money Twitter - Jim Cramer Twitter - Facebook - Instagram
Questions, comments, suggestions for the "Mad Money" website? madcap@cnbc.com