In a news release Tuesday morning, the U.S. Geological Survey says 38 streamgages are over National Weather Service flood levels and water continues to rise at 172 gauges throughout Texas.
USGS field crews continue to measure flooding throughout Texas as rainfall continues to pour down on the Lone Star State.
The National Weather Service has issued a Flash Flood Watch for parts of central Texas through this evening -- a Flood Watch in North Texas has been extended until Wednesday morning.
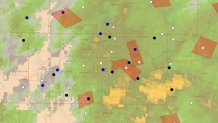
USGS real-time maps of flood and high flow conditions may be accessed using the USGS Texas Water Dashboard.
Twenty USGS field crews are measuring floodwaters and verifying streamgage operations on the Rio Grande, Red, San Antonio, Guadalupe, Colorado, Brazos and Trinity River Basins. Today, crews will be flagging high-water marks on the Llano River, west of Austin, as it nears record flooding.
As more rain is expected, the USGS will continue taking flood measurements that are critical for resource managers and emergency responders to help protect life and property. These data are used by the National Weather Service to develop flood forecasts, the U.S. Army Corps of Engineers to manage flood control, county flood control districts and other local agencies in their flood response activities.
View current monitoring data for almost 800 USGS real-time stream, lake, reservoir, precipitation and groundwater stations in Texas in context with current weather and hazard conditions at the USGS Texas Water Dashboard visible here.
The data can also be read on Twitter via two fully-autonomous USGS feeds which distribute water level and precipitation data during flooding or severe rainfall: @USGS_TexasFlood and @USGS_TexasRain